Showing posts with label Math. Show all posts

Saturday, May 2, 2026

六合彩:刀仔鋸大樹

今天的六合彩投注額已達 4 億港元,距離開獎還有兩小時。

眾所周知,六合彩是典型的「刀仔鋸大樹」遊戲,每注中獎機率僅為 13,983,816 分之一(一千四百萬分之一),本質上是給小市民買個希望而已!簡單來說,就算買了 N 注完全不同的組合,中獎機率都只是 13,983,816 分之 N

但科學點來看,我們能否把這把「刀仔」磨得稍微利一點呢?

首先,在有限的 N 注中,盡可能涵蓋所有 49 個號碼。每注 6 個號碼,若號碼完全不重複,8 可涵蓋 48 個號碼;增加至 9 則能確保 49 個號碼無一遺漏,最後一注雖有重複,卻僅稍微提升了勝率。

現在,可以肯定 6 個「攪出號碼」必會落在上述的 9 注當中(特別號碼暫且不論)。當然,這距離中獎依然非常遙遠,最低限度都要 4 個「攪出號碼」同時落在同一注項中才有機會獲派獎金。事實上,6 個「攪出號碼」極大機會散落在不同注項中,導致顆粒無收。所以,若想進一步提升勝算,可採取「多重覆蓋策略」,即重複上述 9 注的佈陣,但確保每組號碼配置各不相同。依此類推,購買 18 、27、36 或更多,策略上確保相對均勻涵蓋 49 個號碼,購買多少就取決於你想花費多少來買這個希望。(其實,更接近平均涵蓋 49 個號碼的方案只需要 17 注,頭 9 注跟上述做法一樣;然後,將第 9 注的 5 個隨機號碼從 49 個號碼中移除,即剩下 44 個號碼,這 44 號碼只用過一次。如果把這 44 號碼再用一次,則全部號碼都用了兩次。現在,用多 8 注可以覆蓋 42 個,僅餘 2 個未有使用兩次。)

純屬娛樂,不妨買個 18 注(花費 180 港元)試試手氣吧雖然在巨型大樹面前,這點努力依然微不足道,但至少你的刀鋒已比其他隨機旁人銳利了幾分。


2026年5月2日 19:00

Saturday, April 23, 2022

How likely you have a friend already infected with Omicron if you live in Hong Kong?

The official infected number in the fifth wave of Covid in Hong Kong so far is around 1.2 million, out of the total population of 7.5 million. So, 16% of our population have got infected with Omicron, and 84% not yet infected. This means the probability that any particular person in Hong Kong has got infected is 0.16. Let's assume this is the case.

Suppose you have N friends. The question is how likely at least one of your friends is among the 1.2 million. A shortcut to finding the answer is to first consider the complementary question of how likely none of your friends has got infected, and that's simply 0.84N.

The complement of this probability is exactly the probability of having at least one of your friends infected, which is 1 – 0.84N.

So, if you have 10 friends, i.e., N = 10, you have 82.5% chance of having at least one of your friends infected. If you have 20 friends, it's 96.94% chance, and if you have 40 friends, 99.9%. On average, each person has around 150 contacts on her or his phone book, according to Dunbar's number. That means the chance is 1.


April 24, 2022

Saturday, January 16, 2021

How time flies: Predicting when your life shall end

Every summer vacation in primary school was like a never ending holiday, and in my mind, still, the six years in primary school were very long, and definitely much longer than the seven years in secondary school. My memories of the days in the 2000s and 2010s are like yesterday, but those of my primary school days are much older history, disproportionally older! One thing for sure is that the perception of time duration gets shorter as one becomes older! In other words, time moves faster when you get older! So, depending on how old you are, your perception of a 10-year duration can be quite different!

The perceived absolute time also changes as one gets older! When you're young, you felt things that happened 40 years ago were like ancient history! But as you get older, things that happened 40 years ago seemed really not that long ago to you!

You probably still find the music of the 2010s pretty good. Way back, when you're a kid, your perception of the music that your mother loved was like ancient tune! The perception of time clearly changes as you grow older! That seems to be unavoidable, and you can do nothing to revert it. The question is not why, but how fast? Can we possibly work out how fast our perceived time shrinks? If you know the answer, you probably know how rapidly you age and perhaps also when your life shall end (disregarding accidental life-threatening events).

Taking another perspective, if our life ends at the time when our perceived time has shrunk to zero, or in practice shortened to a threshold point that life becomes almost meaningless, then one could possibly predict his own lifespan based on his own perception of time while he still lives and continues to age. This in theory should work!

Suppose your perceived time is Tperception while the actual time is T. A simple first order law that describes how rapidly your perceived time shrinks with time is:

Tperception = T exp( –T / τ )

where the parameter τ determines how fast (by how much) your perception of time would shrink over a fixed time lapse. Experience suggests that time perception shortens by half at the age of 25, around the time when one finishes college and gets to the real world. This means τ is roughly 37, because exp(–25/37) ≈ 0.5.

Hong Kong's average lifespan is 88 for women and 83 for men, say 85 for any average person. Thus, our perceived time has shortened to around 10% of the actual time at the end of our life, since exp(–85/37) = 0.1. We may say that if one perceives time as 90% shorter than it actually is, life is no longer meaningful!

If you know how rapidly your perception of time shortens, i.e., the value of τ, you should theoretically know when your life shall end.


January 16, 2021

Thursday, January 30, 2020

Will Hong Kong be in for a severe outbreak?

A novel coronavirus began to spread from Wuhan in December 2019, and now infected cases are confirmed in almost every province in China; and in the past 10 days has flown to other Asian countries and across the Pacific as well, with over 7000 people infected globally so far. Hong Kong has imported 10 cases via its many ports directly bordering with the mainland. Though Hong Kong people are vigilant of the outbreak, the painful memory of SARS has created tremendous stress and fear. The question is: will Hong Kong repeat history and be in for another severe outbreak?

Here is my quick and crude analysis, based on limited data

Data

From 22/1 to 29/1, the number of confirmed cases in HK grew from 0 to 10.

  • 23/1 +2 cases, total=2

  • 24/1 +3 cases, total=5

  • 26/1 +3 cases, total=8

  • 29/1 +2 cases, total=10

Model

My model is based on the simple rationale that new cases are related to existing cases, both within HK and imported from Wuhan. To keep it simple, I assume the bigger Wuhan area being the entire mainland. So, for Hong Kong, it is sufficient to assume just Hong Kong-Wuhan(=Mainland) interaction. So, how fast our number grows depends on

1. our own number

2. Wuhan’s number

3. recovery rate (awareness, protection, etc)

Yes, this is essentially a simplified "SIR" model*, as the academics used to call it. So, I am just pulling out the following simple equation, assuming that the incubation period is 10 days, i.e., in any day, people who can infect you are actually 10 times more than the infected number because they do not have symptom in the first ~10 days after being infected. This is just

RateHK(t) = αHK * (10) * NHK + βHK * τHK * 10 * NWγ * (NHK+NW)

where

  • RateHK(t) = rate of increase of infected cases, i.e., number of new cases per day;

  • NHK = number of infected cases in HK;

  • NW = number of infected cases in Wuhan (mainland);

  • α, β = infection rates;

  • γ = recovery rate;

  • τ = traffic factor (with this parameter, I can extend the model to other cities of the entire China).

Or equivalently, by redefining parameters for simplicity's sake (only for HK anyway), we have

RateHK(t) = ΑHK * NHK + ΒHK * NWΓ * (NHK+NW)

Now, filling in the past data (limited though), the average rates in 22-23/1, 23-24/1 and 24-26/1 are

  • RateHK(ave) = 2 = ΑHK * 2 + ΒHK * 4000 – ΓHK * 0.05 * 4002

  • RateHK(ave) = 3 = ΑHK * 5 + ΒHK * 4500 – ΓHK * 0.1* 5005

  • RateHK(ave) = 1.5 = ΑHK * 8 + ΒHK * 6000 – ΓHK * 0.5 * 6008

The factor 0.05, 0.1 and 0.5 in the third term is to adjust the society’s awareness of self-protection that retards the transmission rate. At the beginning, awareness was very poor in the mainland, I would say 0.05 as the factor of awareness that reduces the recovery rate. Then, in later few days, people get better educated, say being improved to 0.1. Then, at the latest time, I assume that most are vigilant, hence 0.5. This factor is necessary unless we make alpha and beta time-varying to address the same effect.

Solving the equations from the data, we get ΑHK = 0.405, ΒHK = 0.0003782, and ΓHK = 0.0016.

Prediction

So, here we go (assuming full awareness of self-protection):

RateHK = 0.405 NHK + 0.0003782 NW – 0.0016 * 1.0 * (NHK+NW)

Just a bit of nasty arithmetics, averaging over next 30 days, NHK should be adjusted to NHK(now) + RateHK*15. So, the next 30 days, we have

RateHK = 0.405 (NHK(now)+RateHK*15) + 0.0003782 NW – 0.0016 * 1.0 * (NHK(now)+RateHK*15+NW)

Assume Wuhan’s outbreak continues in the next 4 weeks. Let’s speculate 3 scenarios, depending on the mainland situation and assuming that our borders remain opened (at least our CE had insisted it be so).

  1. WORST: For extreme outbreak, let NW = 100000 average in Feb.

  2. POOR: For severe outbreak, let NW = 50000 average in Feb

  3. HOPEFUL: If outbreak in Wuhan (mainland) is under control, let NW = 10000 average in Feb.

PREDICTION of Rate_HK for next 30 days:

  1. WORST: RateHK = 15 cases per day

  2. POOR: RateHK = 7 cases per day

  3. HOPEFUL: RateHK = 0 cases per day (as RateHK < 0)

Conclusion

I don't have enough data to establish a confidence level. Perhaps somewhere between HOPEFUL and POOR is the most likely event, as the mainland number continues to soar over 10,000!

I must also confess that I did not consider the contact network and individual behavior in the above analysis. So, not perfect though, still I would say they aren't completely unreasonable estimates.


30 January 2020


__________________*M. Small, P. Shi and C. K. Tse, "Plausible Models for Propagation of the SARS Virus," IEICE Transactions on Fundamentals of Electronics Communications and Computer Sciences, vol. E87-A, no. 9, pp. 2379-2386, September 2004.M. Small, C. K. Tse, and D.M. Walker, "Super-spreaders and the rate of transmission of the SARS virus," Physica D, vol. 215, pp. 146-158, March 2006.

Monday, April 29, 2019

Counting number in protest march

Every time after a protest march was held, I am always curious about the huge discrepancy between the Police's and the organizer's estimates of the number of people who participated in the march. In yesterday's protest against the extradition law1, the Police reported "22K at peak time", while the organizer claims there were 130K! So, they surely had done the counting in very different ways!

The Police's "22K at peak time" clearly implies a snapshot approach which only makes sense when the area is fixed and well defined. In yesterday's protest, however, people actually moved from Causeway Bay to Central over a period of 2 hours. So, we shouldn't be counting number at a particular time! Rather, we should be counting how many people had moved along the path of the march over a period of time. In other words, it is a flow problem rather than a static counting problem. Imagine you turn on the water tap in your kitchen and let water flow out for two hours. How much water can you collect at the end? That's the question!

Clearly, "22K at peak time" ("最高峰時有2萬2千人") is literally absurd, as far as a flow problem is concerned. Does "peak time" refer to the time when the largest number of people were present in the whole scene (from Causeway Bay to Central)? Did the Police take a snapshot at a particular instant of time and recorded a maximum of 22K people? Why does this "22K at peak time" relevant to the actual number of people who participated in the march?

In fact, the number can be quite easily worked out if it is taken as a flow problem. Let’s put the road in the "horizontal" direction for ease of referencing. (See figure below.) Suppose in roughly every S sec, a group ("vertical" line) of N people have flown through an observation point on the road. The flow rate is N/S.

Suppose three car lanes accommodate about N people lining up orthogonal to the road. News reported that people began walking from 3:40 pm, and the last group departed around 5:45 pm, i.e., a duration of 125 minutes.


The flow rate is just the total number of people flowing through the path divided by the total time, i.e.,

Now the question is how many people have moved through the observation point from 3:40 pm to 5:45 pm? A rough but reasonable estimate can be made if we take:

  • Total time = 125 x 60 sec

  • N = 25 , S = 2 (i.e., 25 people flew through every 2 sec)

Thus, there were 125 x 60 x N / S = 93,750 people passing through the observation point!!

If more or less people (20 < N < 30) actually moved faster or slower (1.5 < S < 3), the answer would be different. But the magnitude is still pretty much within the range 50,000 to 150,000.

I would say 90K shouldn’t be too far, after discounting early leavers. But if you include everyone who showed up, over 100K is still very probable. For this kind of protest marches, it makes no sense to talk about number at particular time, and as I said, the Police's "22K at peak time" is literally absurd. In yesterday's case, the main factor was the rather long duration of flow, more than two hours through a point along the trajectory!


April 29, 2019


_______________________1 Estimated 130,000 protesters join march against proposed extradition law that will allow transfer of fugitives from Hong Kong to mainland China — South China Morning Post, April 28, 2019.

Tuesday, September 25, 2018

How network science assesses Hong Kong's high speed railway?


On September 23, 2018, Hong Kong celebrated the opening of its high speed railway that has been described by government officials as the most beneficial infrastructure project for Hong Kong.1 The $11 billion dollar project indeed provides an alternative mode of travel to major cities in the Chinese Mainland, and according to the government's prediction is expected to hit a daily passenger volume of 80,000 (which was recently downward adjusted). The question, however, is whether it really justifies the huge construction cost and the subsequent expensive maintenance cost.

Network science, a rapidly growing discipline in physics and mathematics, may shed light on the pros and cons of Hong Kong's high speed railway as a means for connecting with the rest of China. A railway system is a network, which is characterized by a set of so-called nodes connected by links. For a railway network, a station is a node, and its importance may be measured by a few parameters, among which the "degree" of a node is often used to assess its connectivity. In non-technical terms, the "degree" of a station is just the number of other stations it connects immediately with. A high-degree station is what we normally refer to as a hub, like Shinjuku in Tokyo, King's Cross St Pancras in London, or Wuhan in China. Obviously, a hub will always attract a large volume of traffic as it radiates and connects to multiple nodes. In a railway network, the majority of nodes has a degree of two, connecting only two neighboring nodes. A few, however, has a high degree.

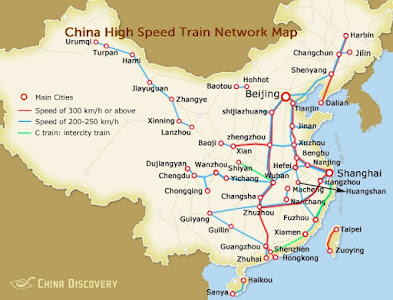
According to the latest railway map2,

  • Degree of Guangzhou = 7 (double links counted as 2)

  • Degree of Shenzhen = 5

  • Degree of Hong Kong = ?


How about Hong Kong? It has the least degree, i.e.,
one, as it is situated at the end of a line. Unless such a node has other fundamental attributes that make it more important than others, it cannot be an important node from the network's point of view. In network science, the so-called weight of a node may make it more important, like the points-of-interest, population size, social activities, financial activities, etc. Hong Kong, being a Special Administrative Region, may have a heavier weight, but the Hong Kong high-speed railway station is topologically a terminal node and can never serve to connect others. This remains a fundamental constraint, unlike Hong Kong's airport which has been developed to be a hub. The key point is that the railway system, restricted by topology, cannot allow any station to develop into a hub if it was not designed for such a function.

Hong Kong is a one-degree node connecting permanently with an intermediate Futian station which then connects to Shenzhen North station, and that's it. Theoretically, the topological efficiency (node's) is also inherently low as it is located on one single route and right at its terminal. Other network attributes will also consistently rate Hong Kong's station as a less important node, e.g., the so-called betweenness centrality that reflects a node's ability of carrying passengers through it from various possible itineraries.

Hong Kong as a terminal station in the high-speed rail system is an inherently unimportant node. The high-speed railway is expected to play a very limited role as a means of transportation. Simply put, it connects only to Shenzhen, through which to other nodes serially (along one-dimensional lines). Under the current topological constraints (i.e., HKSAR being a boundary point, without through traffic), Hong Kong's high-speed rail has no room for further development. A literal dead-end so to speak!

September 26, 2018

Recent Popular Post